8 GeoLightViz
GeoPressureR includes the shiny app GeoLightViz, designed to label twilight data and interactively tune light-based geolocation settings.
It is especially useful when pressure and/or acceleration are not available, because you can define and refine stationary periods directly from twilight patterns.
8.1 Run GeoLightViz
Start the app with the geolightviz() function using either
geolightviz(tag) # tag object
geolightviz("18LX") #  interim file
geolightviz("data/twilight-label/18LX-labeled.csv") # the label file directly
By default, the app starts in a background R process (run_bg = TRUE), so your console remains available.
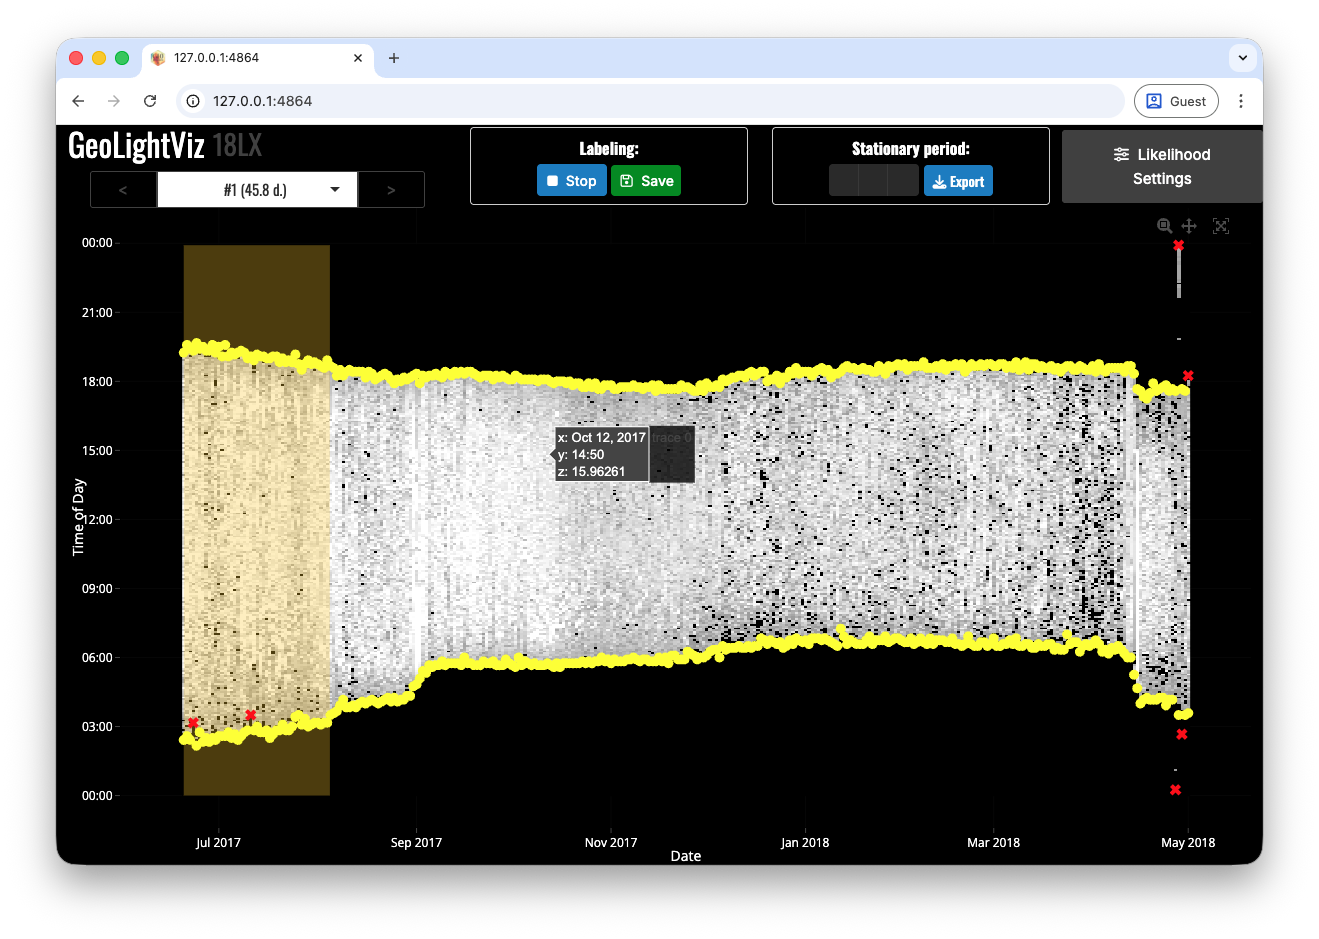
8.2 Label Twilight
Start with twilight labelling before adjusting map or calibration settings.
The left panel shows the light heatmap and extracted twilights (yellow dots).
- Click
Editto enter twilight-labelling mode. - Mark outliers as
"discard"by clicking points individually or drag-selecting multiple points. - Click
Stopwhen finished. - Click
Save(orExport) to write the label file.
When auto-save is available, the output is written to data/twilight-label/{id}-labeled.csv.
8.3 Define Stationary Periods
If pressure/acceleration are unavailable, you can define stap directly in GeoLightViz:
- Use
+to add a stationary period by drawing a time rectangle on the light panel. - Use
pento redraw the range of the currently selected stationary period. - Use
-to remove the current stationary period. - Use the top selector (or
</>) to move across stationary periods. - Click
Save(orExport) to write thestapfile.
When auto-save is available, the output is written to data/stap-label/{id}.csv.
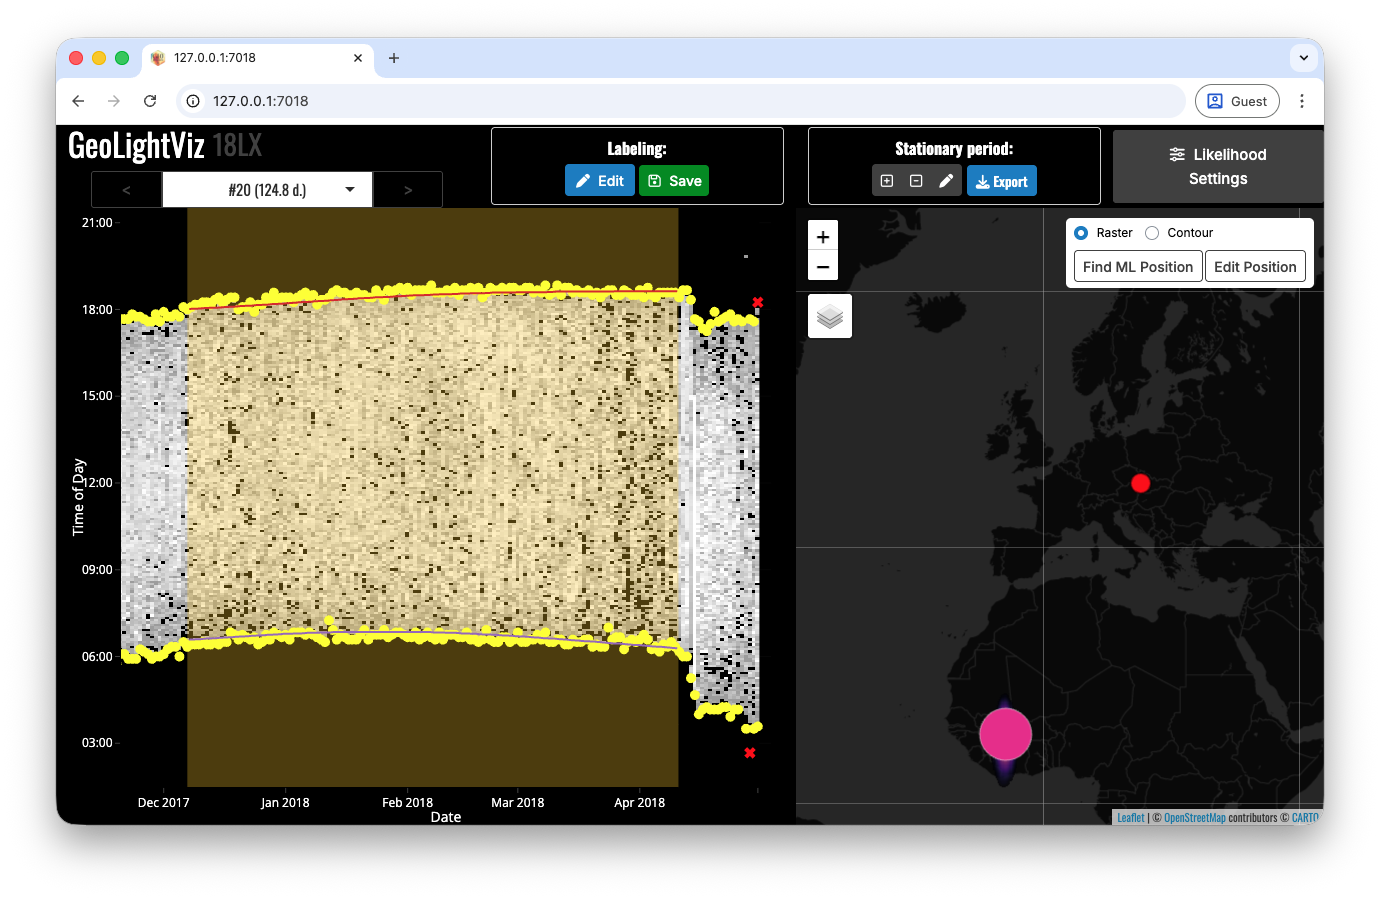
8.4 Map panel
The right map panel is shown only if:
-
tag_set_map()has been run (map extent + scale are defined), and - at least one stationary period is available.
When the map is available, the time and space views are linked:
- Selecting a stationary period updates both the highlighted time window (left) and the corresponding light likelihood map (right).
-
Edit Positionlets you click on the map to test candidate positions and immediately inspect the implied twilight lines in the left panel. -
Find ML Positionsets the stationary-period location to the maximum-likelihood map position.
8.5 Adjust Twilight Calibration
Open Likelihood Settings to tune the two main light-map components:
-
Calibration smoothness via
twl_calib_adjust, with immediate visual diagnostics. - Twilight aggregation strength (log-linear pooling factor) controlling how strongly multiple twilights are combined within each stationary period.
This is useful for sensitivity checks before running the full geolight_map_* workflow.
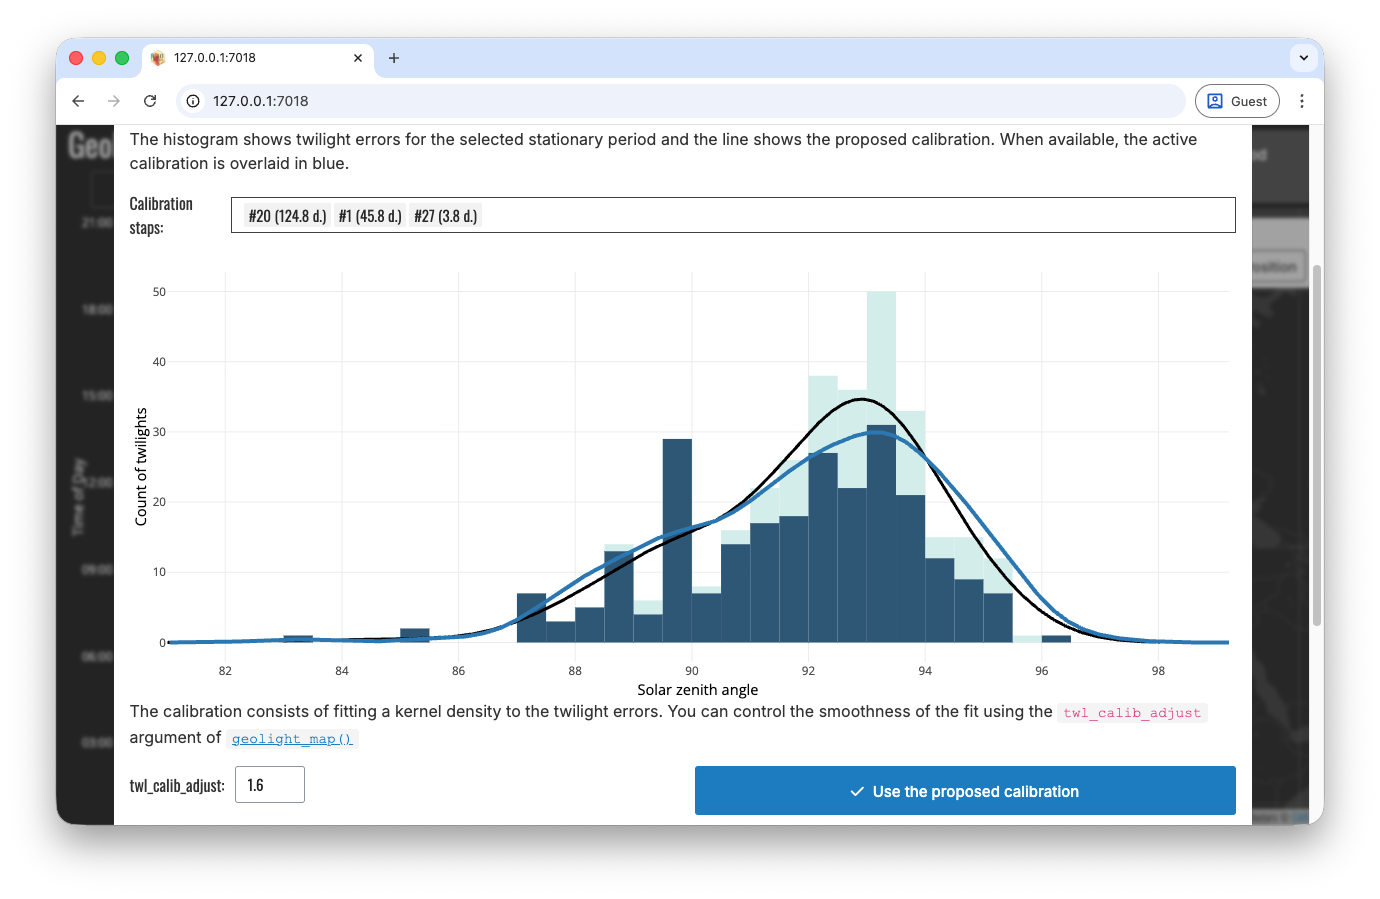
Likelihood Settings modal with calibration diagnostics (twl_calib_adjust) and log-linear pooling controls for map aggregation.