4 Light map
In the advanced tutorial, we construct the same three products with a Great Reed Warbler (18LX), this time including light and wind data.

This first chapter focuses on constructing a likelihood map from light data. This step is optional in the workflow, but can be helpful in most case. Typically, it is quite informative for short stopovers with long flights before and after. It can also be helpful to cross-check pressure map can reduce the computational cost of the creation of the graph.
Here, we use an approach based on the threshold method and using a calibration of zenith angle (rather than time of sunrise). This approach is presented in more detail in section 2.4 of Nussbaumer et al. (2023).
A more thorough introduction to geolocation with light data can be found in the geolocation manual (Lisovski et al. 2020). Note that other methods producing likelihood maps could also be used such as the ones presented in Basson et al. (2016) or Bindoff et al. (2018).
4.1 Basic tutorial catch up
Before getting into light data, we first need to create, label, and set the map for the tag object. We essentially perform the same steps than in Tag object and Pressure map in just a few lines using the native pipe operator |>. Note that this assumes the labelling has already been done.
tag <- tag_create(
"18LX",
crop_start = "2017-06-20",
crop_end = "2018-05-02",
quiet = TRUE
) |>
tag_label(quiet = TRUE) |>
tag_set_map(
extent = c(-16, 23, 0, 50),
scale = 4,
known = data.frame(
stap_id = 1,
known_lat = 48.9,
known_lon = 17.05
)
) |>
geopressure_map(quiet = TRUE)4.2 Estimate twilights
We find the twilight (time of sunrise and sunset every day) with twilight_create(), which performs the same tasks as TwGeos::FindTwilight(), but using a matrix representation. This approach is faster but possibly less general.
By default, the threshold of light twl_thr is automatically defined as the first and last light of the day (i.e., tag$light$value>0). The twl_offset parameter is used to centre the night/day for the matrix representation of light. A good centring is necessary to find the correct twilights.
tag <- twilight_create(tag, twl_thr = NULL, twl_offset = NULL)We can visualize the twilight and check the centering of the day.
plot(tag, type = "twilight")Re-run twilight_create with a different twl_offset until the night/day is properly centred.
Because we have already label the stationary period before, the plot indicates which stationary period the twilight belongs to with the dot color. This can be useful to distinguish outliers from a change in the bird position.
4.3 Manual labelling of twilight
Twilight outliers should be discarded from the analysis using Trainset https://trainset.raphaelnussbaumer.com/.
Use twilight_label_write() to generate the twilight label csv file.
twilight_label_write(tag)✔ './data/twilight-label/18LX.csv' written successfully.Click on “Upload Twilight Label” to customize the interface for twilight labelling. Similar to tag labelling, simply label the twilights to be ignored with the "discard" label.
Twilight outliers can be picked out visually when they don’t follow a smooth line.
The color of the dots indicative of the stationary period can be helpful to pick out outliers from a change in the bird’s position: while changes in twilight within a stationary period should be smooth, changes between positions can be abrupt.
Note that modifying the label of twilight to a different stationary period has no influence later on, as only "discard" labels are read with twilight_label_read().
Avoid Over-edit the calibration period. The variability of twilight is important to build a calibration which adequately captures the range of uncertainty of a twilight. As it is easier to pick out outliers during long stationary periods (calibration period) than during shorter ones, there is a risk of having more variability during short stationary periods and thus biases in the estimated position.
When you have finished labelling, export the file in the same folder keeping -labeled in the name (automatically added by Trainset).
tag <- twilight_label_read(tag)
plot(tag, type = "twilight")4.4 Compute likelihood map
The computation of the light likelihood map for each stationary period is performed with geolight_map() and follows these three steps:
- Perform a calibration of the zenith angle (i.e., the angle of the sun at sunrise and sunset) with a kernel density (see
stats::kernel()). This requires knowing the position of the bird for a least one stationary period. This position should be specified with theknowndata.frame intag_set_map(). - Compute a likelihood map for each twilight. This step consists of computing, for each pixel of the map, the zenith angle and the corresponding probability using the calibrated kernel distribution.
- Aggregate all likelihood maps of the same stationary period into a single map using a log-linear pooling. See probability aggregation for more information on log-linear pooling.
tag <- geolight_map(
tag,
twl_calib_adjust = 1.4,
twl_llp = function(n) log(n) / n,
quiet = TRUE
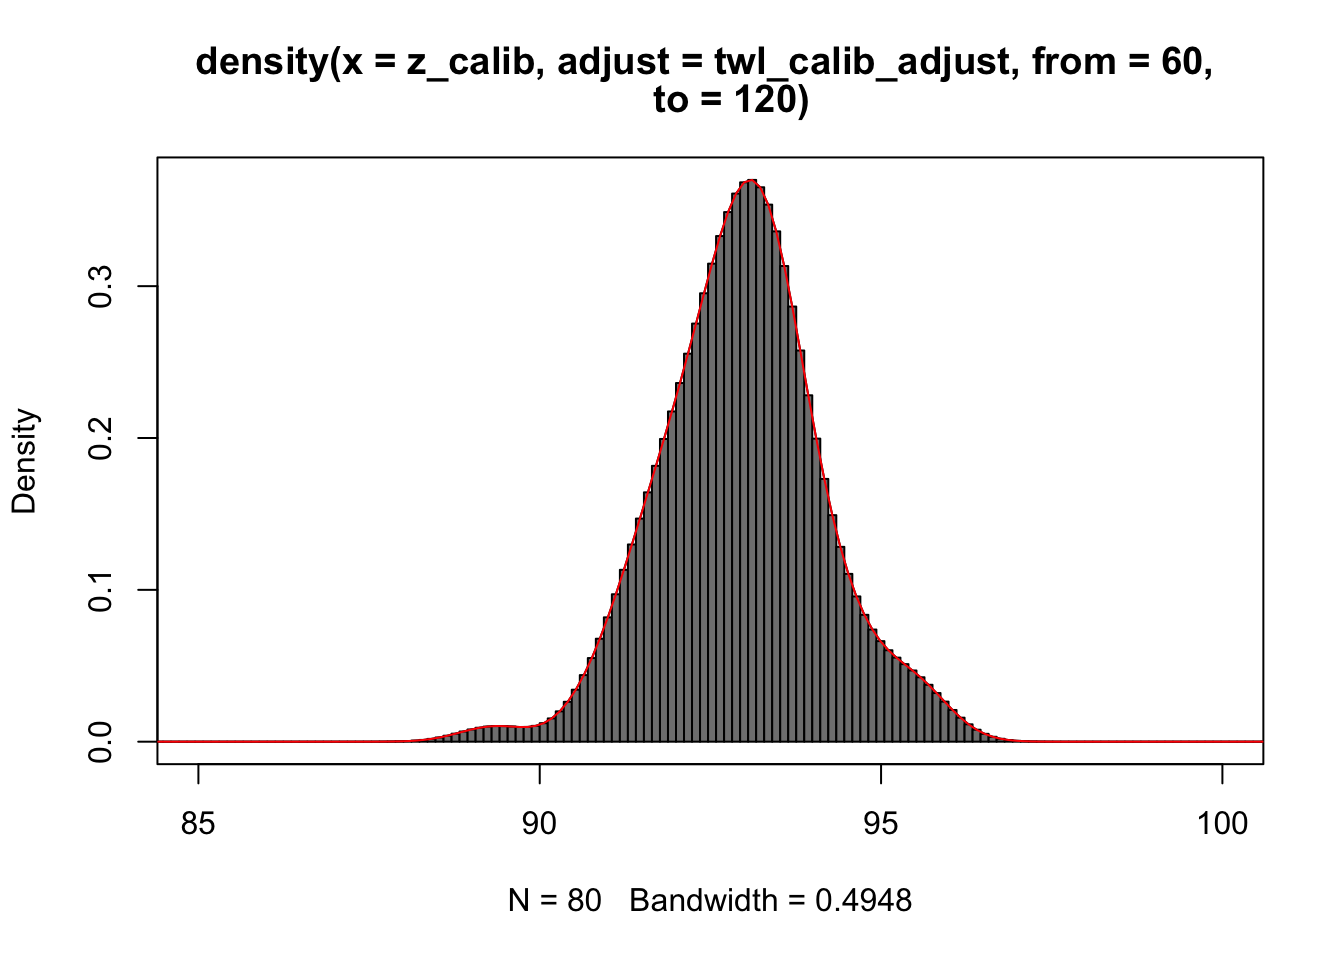
)The twl_calib_adjust parameter adjusts the smoothness of the fit (see stats::density()). Because the zenith angle error model is fitted with data only at the calibration site, and we are using it for all locations of the bird’s journey, it is safer to assume a broader/smoother distribution (twl_calib_adjust > 1).
It is recommended to always check the calibration fit tag$param$twl_calib with
barW <- median(diff(tag$param$geolight_map$twl_calib$x)) / 2
plot(tag$param$geolight_map$twl_calib, xlim = c(85, 100))
rect(
xleft = tag$param$geolight_map$twl_calib$x - barW,
ybottom = 0,
xright = tag$param$geolight_map$twl_calib$x + barW,
ytop = tag$param$geolight_map$twl_calib$y,
col = gray(0.5)
)
lines(tag$param$geolight_map$twl_calib, col = "red")
Finally, we can visualize the probability map for each stationary period:
plot(tag, type = "map_light")It is worth checking how the likelihood map of light and pressure compare before building the graph. They should always overlap. If this is not the case, the tag and/or twilight labelling needs to be adjusted.
This task is best performed with GeoPressureViz, presented in its dedicated chapter. For now, we can simply visualize the resulting likelihood map of pressure and light combine.
plot(tag, type = "map")4.5 Check light label
In the same way that pressure label needs to be checked, light label can also be checked. The idea is to compute the estimated trajectory, compute the twilights along this trajectory and compare the empirical twilight measured/computed above. We use here tag2path() which computes the most likely position for each stationary period (i.e. regardless of flight duration/movement model). We interpolate each position below 2 days to avoid unrealistic position estimates.
path <- tag2path(tag, interp = 2)This path can be visualized with plot_path(path)
We can compute the theoretical twilights which should be observed by a bird on this path using path2twilight()
twilight_line <- path2twilight(path)This theoretical twilight can be compared to the empirical one using the plot_tag_twilight()
plot_tag_twilight(tag, twilight_line = twilight_line, plot_plotly = T)