Compute likelihood map from pressure data
Source:R/geopressure_map.R, R/geopressure_map_likelihood.R, R/geopressure_map_mismatch.R
geopressure_map.RdThe geopressure_map() function computes a likelihood map for each stationary period based on
pressure measurements. It is a wrapper of the following two child functions:
geopressure_map_mismatch()computes the mismatch maps between the pressure sensor measurements and the ERA5 reanalysis database.geopressure_map_likelihood()converts the mismatch maps into a likelihood map.
See below for details. For more background on the method behind these functions, please refer to Nussbaumer et al. (2023a; doi:10.1111/2041-210X.14043 ).
Usage
geopressure_map(
  tag,
  max_sample = 250,
  margin = 30,
  sd = 1,
  thr_mask = 0.9,
  log_linear_pooling_weight = function(n) log(n)/n,
  timeout = 60 * 5,
  workers = "auto",
  era5_dataset = "both",
  keep_mask = FALSE,
  keep_mse = FALSE,
  compute_known = FALSE,
  debug = FALSE,
  quiet = FALSE
)

geopressure_map_likelihood(
  tag,
  sd = formals(geopressure_map)$sd,
  log_linear_pooling_weight = function(n) log(n)/n,
  keep_mse = TRUE
)

geopressure_map_mismatch(
  tag,
  max_sample = formals(geopressure_map)$max_sample,
  margin = formals(geopressure_map)$margin,
  keep_mask = TRUE,
  thr_mask = 0.9,
  timeout = 60 * 5,
  workers = "auto",
  era5_dataset = "land",
  compute_known = FALSE,
  debug = FALSE,
  quiet = FALSE
)
Arguments
- tag
a GeoPressureR
tagobject- max_sample
the computation of the maps is only performed on
max_sampledatapoints of pressure to reduce computational time. The samples are randomly (uniformly) selected on the time series.- margin
the margin is used in the mask map to accept measurement errors, small-scale topography, and vertical movements of the bird (unit in meters, 1hPa~10m).
- sd
standard deviation of the pressure error. Numeric of length 1 or number of stationary periods.
- thr_mask
threshold of the percentage of data points outside the elevation range to be considered not possible.
- log_linear_pooling_weight
weighting function of the log-linear pooling, taking the number of samples of the stationary periods used and returning the weight of the aggregation. See GeoPressureManual | Probability aggregation for more details.
- timeout
duration before the code is interrupted both for the request on GeoPressureAPI and on GEE (in seconds, see
httr2::req_timeout()).- workers
number of parallel requests on GEE. Integer between 1 and 99.
"auto"adjust the number of workers to the number ofstapelevto query.- era5_dataset
select the dataset to use:
"single-levels"for ERA5 hourly data on single levels (doi:10.24381/cds.adbb2d47 ),"land"for ERA5-Land hourly data (doi:10.24381/cds.e2161bac ) or"both"to use land where available and single-levels otherwise (i.e. over water). LAND has greater precision but is not available on water. Using a single one makes the query faster.- keep_mask
logical defining if the mask map is returned in
tag.- keep_mse
logical defining if the MSE map is returned in
tag.- compute_known
logical defining if the map(s) for known stationary period should be estimated based on twilight or hard defined by the known location
stap$known_l**- debug
logical to display additional information to debug a request
- quiet
logical to hide messages about the progress
Value
Returns the same GeoPressureR tag object including the GeoPressureR map object
tag$map_pressure containing the likelihood map of each stationary period. See map_create()
for details.
If keep_mask and keep_mse are each true, tag also includes the tag$map_pressure_mse and
tag$map_pressure_mask maps, as well as tag$stap$nb_sample, indicating the number of
datapoints used to compute the MSE.
Details
A map will only be computed for the stationary periods included in tag$stap$include and without
a known position tag$stap$known_l** as defined by tag_set_map(). At known stationary
periods, the likelihood map is a map of 0s with a single 1 at the pixel closest to the known
position.
Mismatch map with GeoPressureAPI
geopressure_map_mismatch() computes the mismatch maps on Google Earth Engine via the map
entry point of the GeoPressure API.
This consists of the following steps:
Pre-process pressure: the pressure measurements are first smoothed and downscaled to a 1-hour resolution in order to match ERA-5 resolution (see
geopressure_map_preprocess()).Generate requests: Send a single request to the GeoPressureAPI to generate the Google Earth Engine (GEE) URLs, one for each elevation/stationary period which can be used to compute the maps on the GEE server.
Send the requests: Call the URLs, which will start the computation on the GEE server. At this step, it does not wait for an answer, but sends the requests in parallel to be faster.
Compute and download the maps: When all requests are sent, we wait for the GEE server to return a geotiff file (map) for each elevation/ stationary period.
Post-process maps: Read these geotiff maps as matrix, create the corresponding GeoPressureR
mapobject withcreate_map().
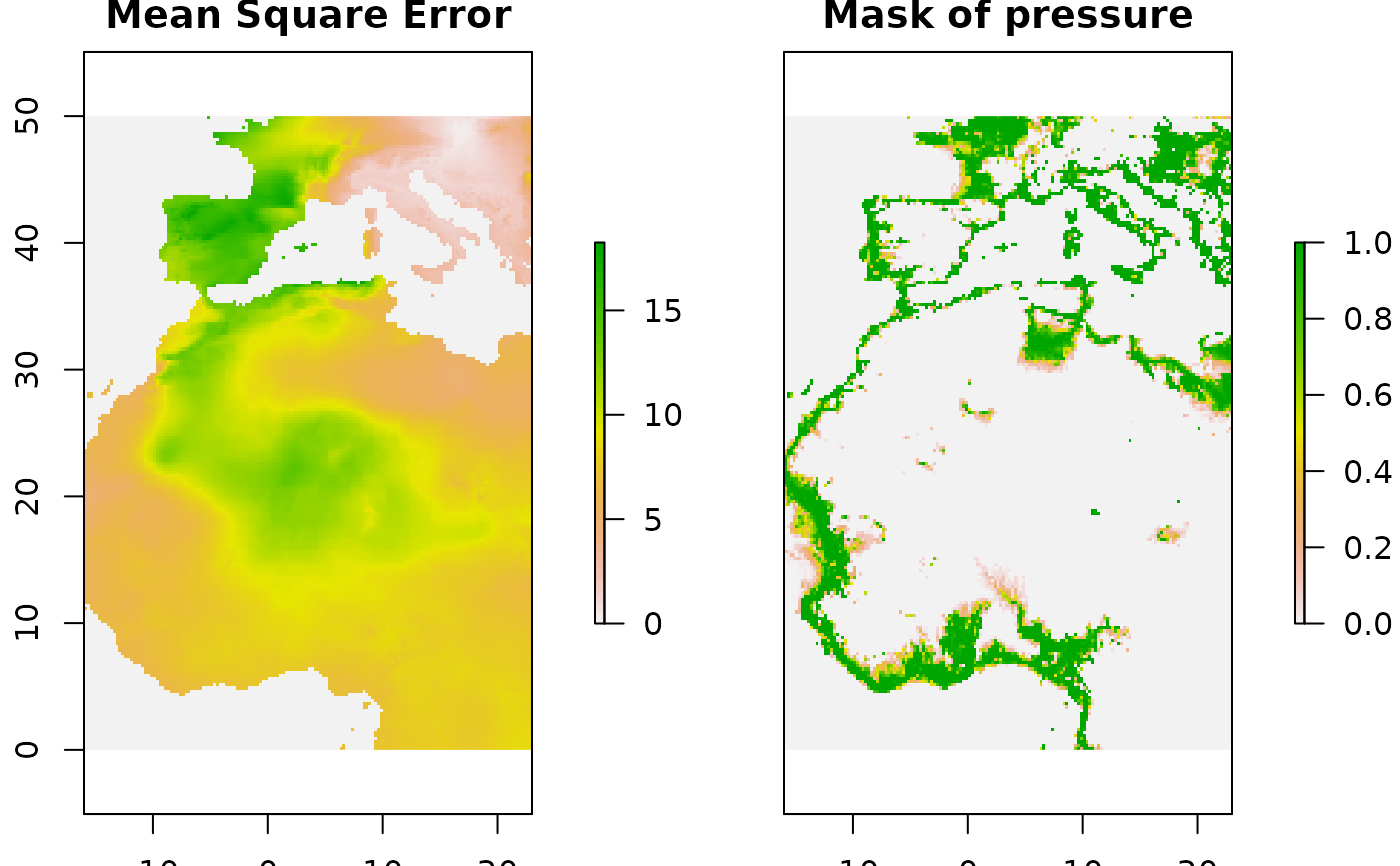
The following two maps are returned for each stationary period:
map_pressure_mse: The Mean Square Error (MSE) between the data logger pressure time series and the reanalysis. The mean error is removed because we assume no specific altitude of the geolocator, thus allowing an altitudinal shift of the pressure time series.
map_pressure_mask (optionally): The mask of the proportion of pressure measurements corresponding to altitude values found within the min and max ground elevation at each location. The altitude value of the geolocator pressure time series is computed with the barometric formula accounting for the temporal variation of pressure (surface-pressure) and temperature (2m-temperature) based on ERA5 data. The min and max ground elevation of each pixel is computed from SRTM-90. This map is only returned if
keep_maskisTRUE.
For more details, read the GeoPressure API documentation .
Elevation levels
It is possible to indicate different elevation levels when the bird was spending time at
locations with different elevations within a general area (~10km), and thus within the same
stationary period. This can be done by using tag$label="elev_x" for all measurements of the
same elevation level x. See more information on the labelling of elevation levels in the corresponding section in the GeoPressureManual.
Behind the scene, each of these elevation levels produces a new request on the GeoPressureAPI. The mismatch maps of all elevation levels belonging to the same stationary periods are combined (as a weighted average) to result in a single mismatch map per stationary period.
Convert mismatch map into likelihood map
We convert the map of the mean square error \(MSE\) and altitude mask \(z_{mask}\) computed
by geopressure_map_mismatch() into a likelihood map with,
$$L = \left( \frac{1}{2 \pi \sigma^2}\right)^{\frac{nw}{2}} \exp \left(-w n \frac{MSE}{2\sigma^2} \right) \left[z_{mask}>T \right],$$
where \(\sigma\) is the standard deviation (sd) of pressure and \(T\) is the mask threshold
(thr_mask).
Because the auto-correlation of the time series is not accounted for in this equation, we use a log-linear pooling weight of \(w=\log(n)/n\) by default, where \(n\) is the number of samples in the time series (i.e., data points used to compute the MSE). See GeoPressureManual | Probability aggregation for details.
Important Note: Since GeoPressure v3.1.0, the threshold of the mask is happening directly
on the GEE server (i.e., during geopressure_map_mismatch()). This allows to compute the MSE
only for pixels which are within the threshold, thus reducing the computational cost
significantly.
References
Nussbaumer, Raphaël, Mathieu Gravey, Martins Briedis, and Felix Liechti. 2023. Global Positioning with Animal‐borne Pressure Sensors. Methods in Ecology and Evolution, 14, 1118–1129 doi:10.1111/2041-210X.14043 .
Examples
withr::with_dir(system.file("extdata", package = "GeoPressureR"), {
tag <- tag_create("18LX", quiet = TRUE) |>
tag_label(quiet = TRUE) |>
tag_set_map(
extent = c(-16, 23, 0, 50),
scale = 4
)
})
tag <- geopressure_map_mismatch(tag,
max_sample = 50,
margin = 20,
thr_mask = 0.95,
keep_mask = TRUE,
quiet = TRUE
)
plot(tag, type = "map_pressure_mse", plot_leaflet = FALSE)
 plot(tag, type = "map_pressure_mask", plot_leaflet = FALSE)
 tag <- geopressure_map_likelihood(tag,
sd = 1,
log_linear_pooling_weight = function(n) log(n) / n
)
plot(tag, type = "map_pressure")
tag <- geopressure_map_likelihood(tag,
sd = 1,
log_linear_pooling_weight = function(n) log(n) / n
)
plot(tag, type = "map_pressure")