This function plots a GeoPressureR tag object as a time series or a map.
By default, type is determined in the following order of preference according to availability:
c("map_pressure", "map_light"), "map_pressure", "map_light", "pressure".
plot.tag() calls different plotting functions depending on type.
"pressure":plot_tag_pressure()"light":plot_tag_light()"acceleration":plot_tag_acceleration()"temperature":plot_tag_temperature()"twilight":plot_tag_twilight()"actogram":plot_tag_actogram()"map_*":plot.map()withtag$map_*as first argument.
Refers to these functions for additional parameters and more flexibility in the plotting.
Usage
# S3 method for class 'tag'
plot(x, type = NULL, ...)
Arguments
- x
a GeoPressureR
tagobject.- type
type of the plot to display. One of
"pressure","acceleration","light","temperature","twilight","actogram","map","map_pressure","map_light","map_pressure_mse","map_pressure_mask","mask_water". Map can be combined by providing a vector of type.- ...
additional parameters for
plot_tag_pressure(),plot_tag_acceleration(),plot_tag_light(),plot_tag_twilight()orplot.map()
Examples
withr::with_dir(system.file("extdata", package = "GeoPressureR"), {
tag <- tag_create("18LX", quiet = TRUE) |>
tag_label(quiet = TRUE) |>
twilight_create() |>
twilight_label_read()
})
# By default, plot will display the time series of pressure
plot(tag)
# Change the `type` to display other sensor
plot(tag, type = "acceleration")
plot(tag, type = "light")
plot(tag, type = "temperature")
plot(tag, type = "twilight")
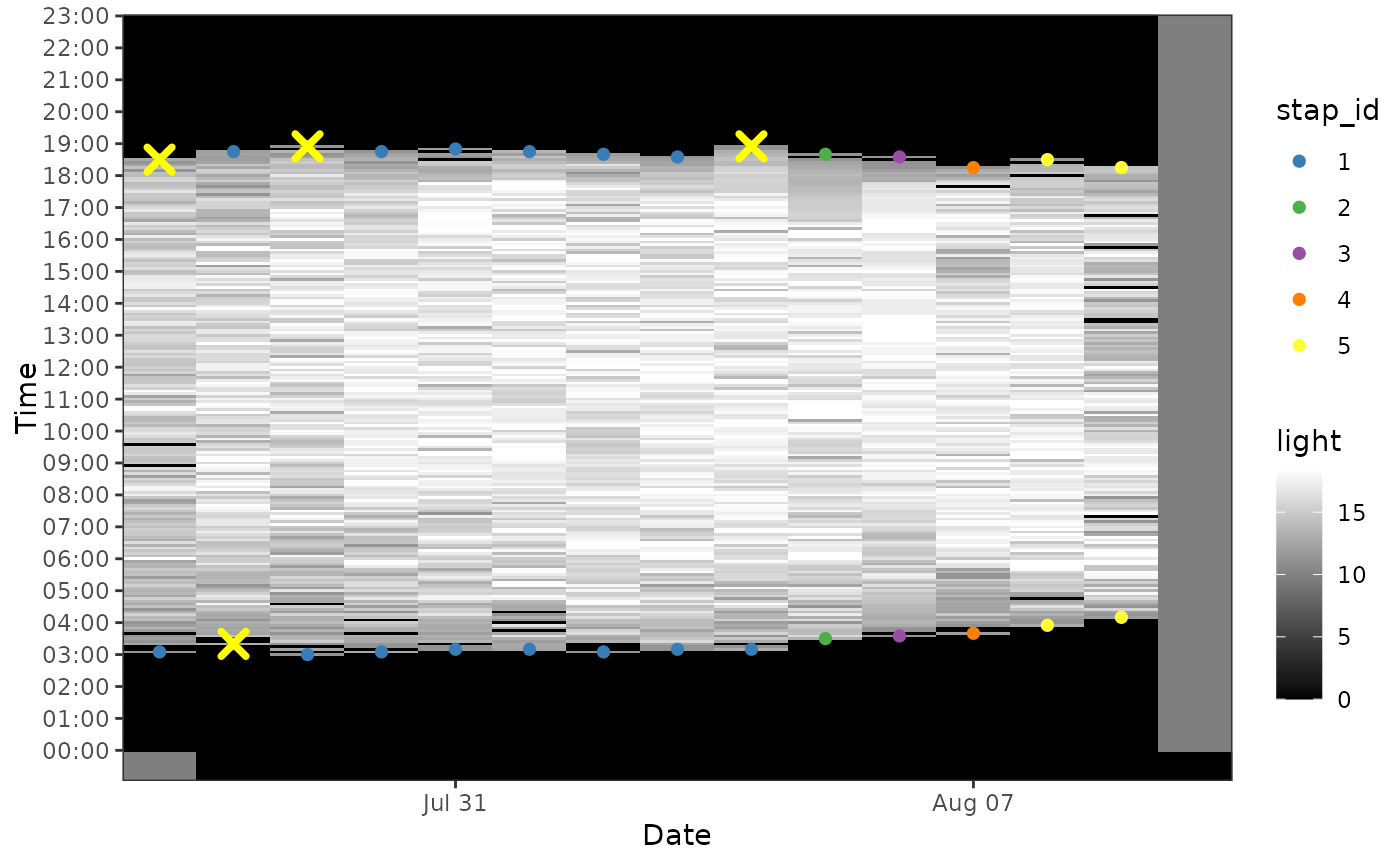
plot(tag, type = "actogram")
 # After you compute any likelihood map, the default will
# become this map (i.e., `type = "map"`)
tag <- tag_set_map(tag,
extent = c(-16, 23, 0, 50),
scale = 4,
known = data.frame(
stap_id = 1,
known_lon = 17.05,
known_lat = 48.9
)
) |>
geopressure_map(quiet = TRUE)
plot(tag)
# The likelihood map of light can be display with
tag <- geolight_map(tag, quiet = TRUE)
plot(tag, type = "map_light")
# When both pressure and light likelihood are present,
# the default is to display their products, equivalent
# to choose `type = c("map_pressure", "map_light")`
plot(tag)
# After you compute any likelihood map, the default will
# become this map (i.e., `type = "map"`)
tag <- tag_set_map(tag,
extent = c(-16, 23, 0, 50),
scale = 4,
known = data.frame(
stap_id = 1,
known_lon = 17.05,
known_lat = 48.9
)
) |>
geopressure_map(quiet = TRUE)
plot(tag)
# The likelihood map of light can be display with
tag <- geolight_map(tag, quiet = TRUE)
plot(tag, type = "map_light")
# When both pressure and light likelihood are present,
# the default is to display their products, equivalent
# to choose `type = c("map_pressure", "map_light")`
plot(tag)