This function display a plot of pressure time series recorded by a tag
Usage
plot_graph_movement(graph, speed = seq(0, 120), plot_plotly = FALSE)See also
Other movement:
bird_create(),
graph_set_movement(),
speed2prob(),
tag_download_wind()
Examples
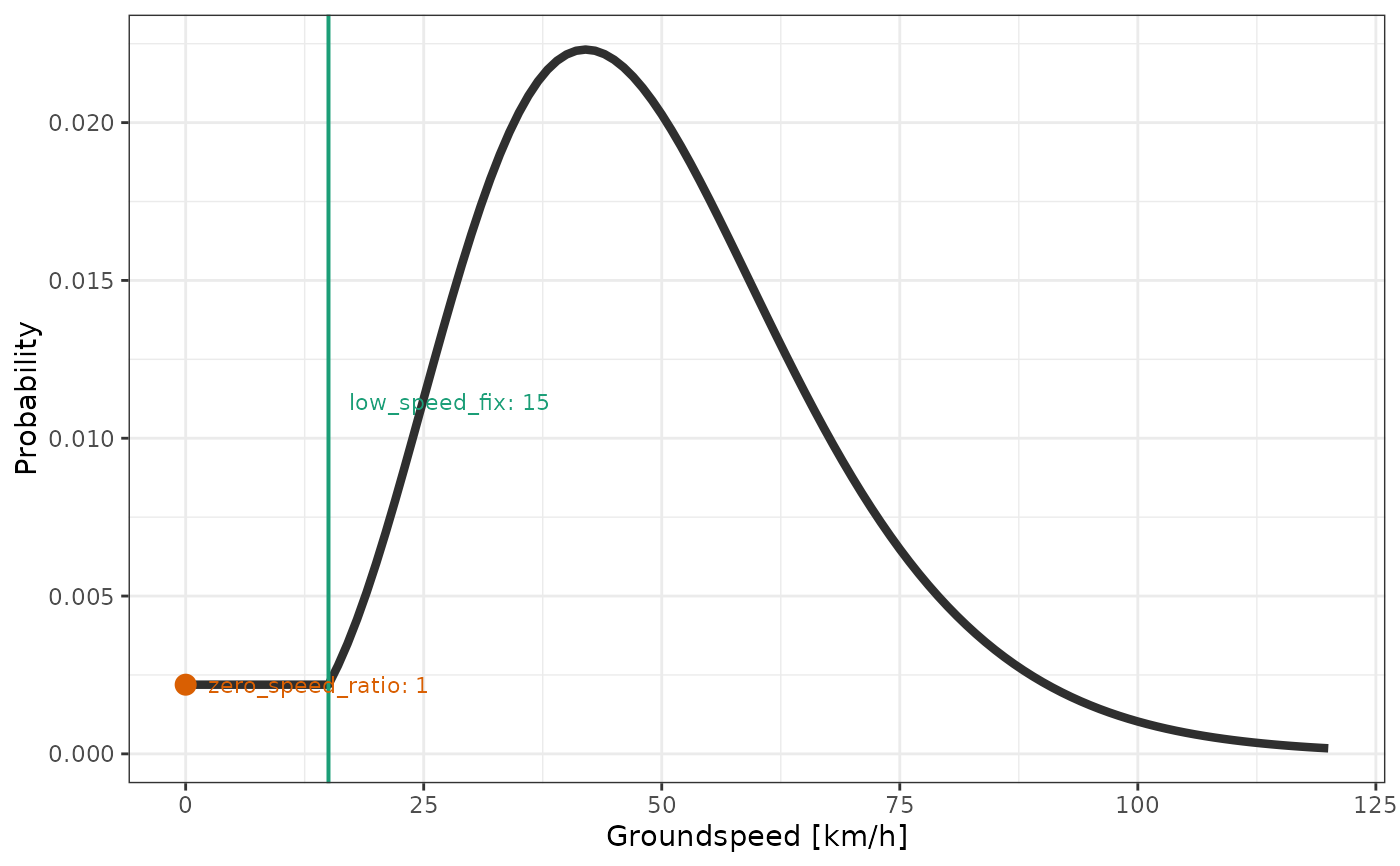
movement_gamma <- list(
type = "gs",
method = "gamma",
shape = 7,
scale = 7,
low_speed_fix = 15,
zero_speed_ratio = 1
)
plot_graph_movement(movement_gamma)
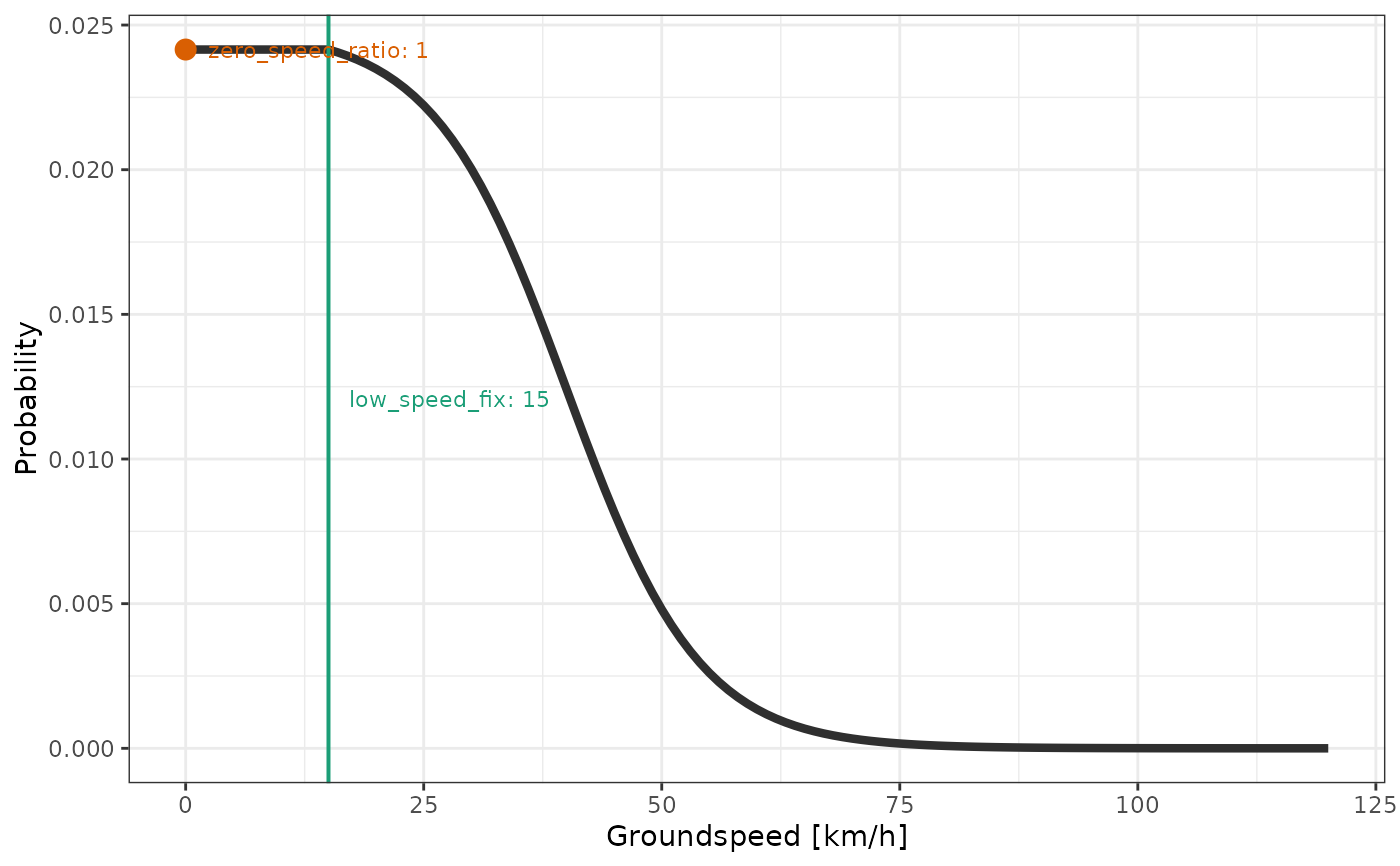
 movement_logis <- list(
type = "gs",
method = "logis",
scale = 7,
location = 40,
low_speed_fix = 15,
zero_speed_ratio = 1
)
plot_graph_movement(movement_logis)
movement_logis <- list(
type = "gs",
method = "logis",
scale = 7,
location = 40,
low_speed_fix = 15,
zero_speed_ratio = 1
)
plot_graph_movement(movement_logis)
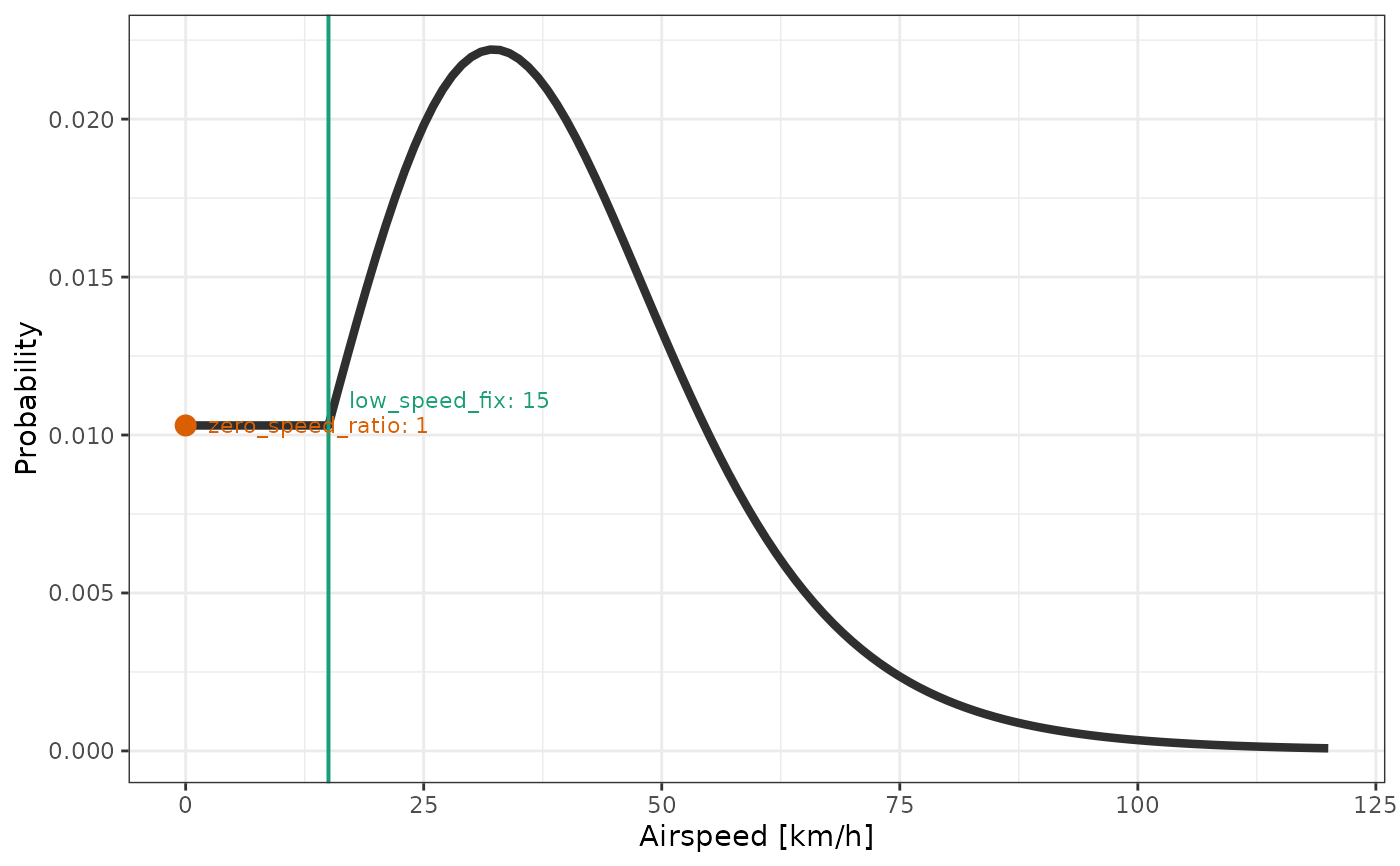
 bird <- bird_create("Example bird", mass = 0.1, wing_span = 0.4, wing_aspect = 7)
movement_power <- list(
type = "as",
method = "power",
bird = bird,
power2prob = \(power) (1 / power)^3,
low_speed_fix = 15,
zero_speed_ratio = 1
)
plot_graph_movement(movement_power)
bird <- bird_create("Example bird", mass = 0.1, wing_span = 0.4, wing_aspect = 7)
movement_power <- list(
type = "as",
method = "power",
bird = bird,
power2prob = \(power) (1 / power)^3,
low_speed_fix = 15,
zero_speed_ratio = 1
)
plot_graph_movement(movement_power)